New Arizona Water Blueprint features!
Explore new features of the Arizona Water Blueprint!
Since the Kyl Center for Water Policy at Morrison Institute launched the Arizona Water Blueprint in June, we've been consistently updating and refining its features.
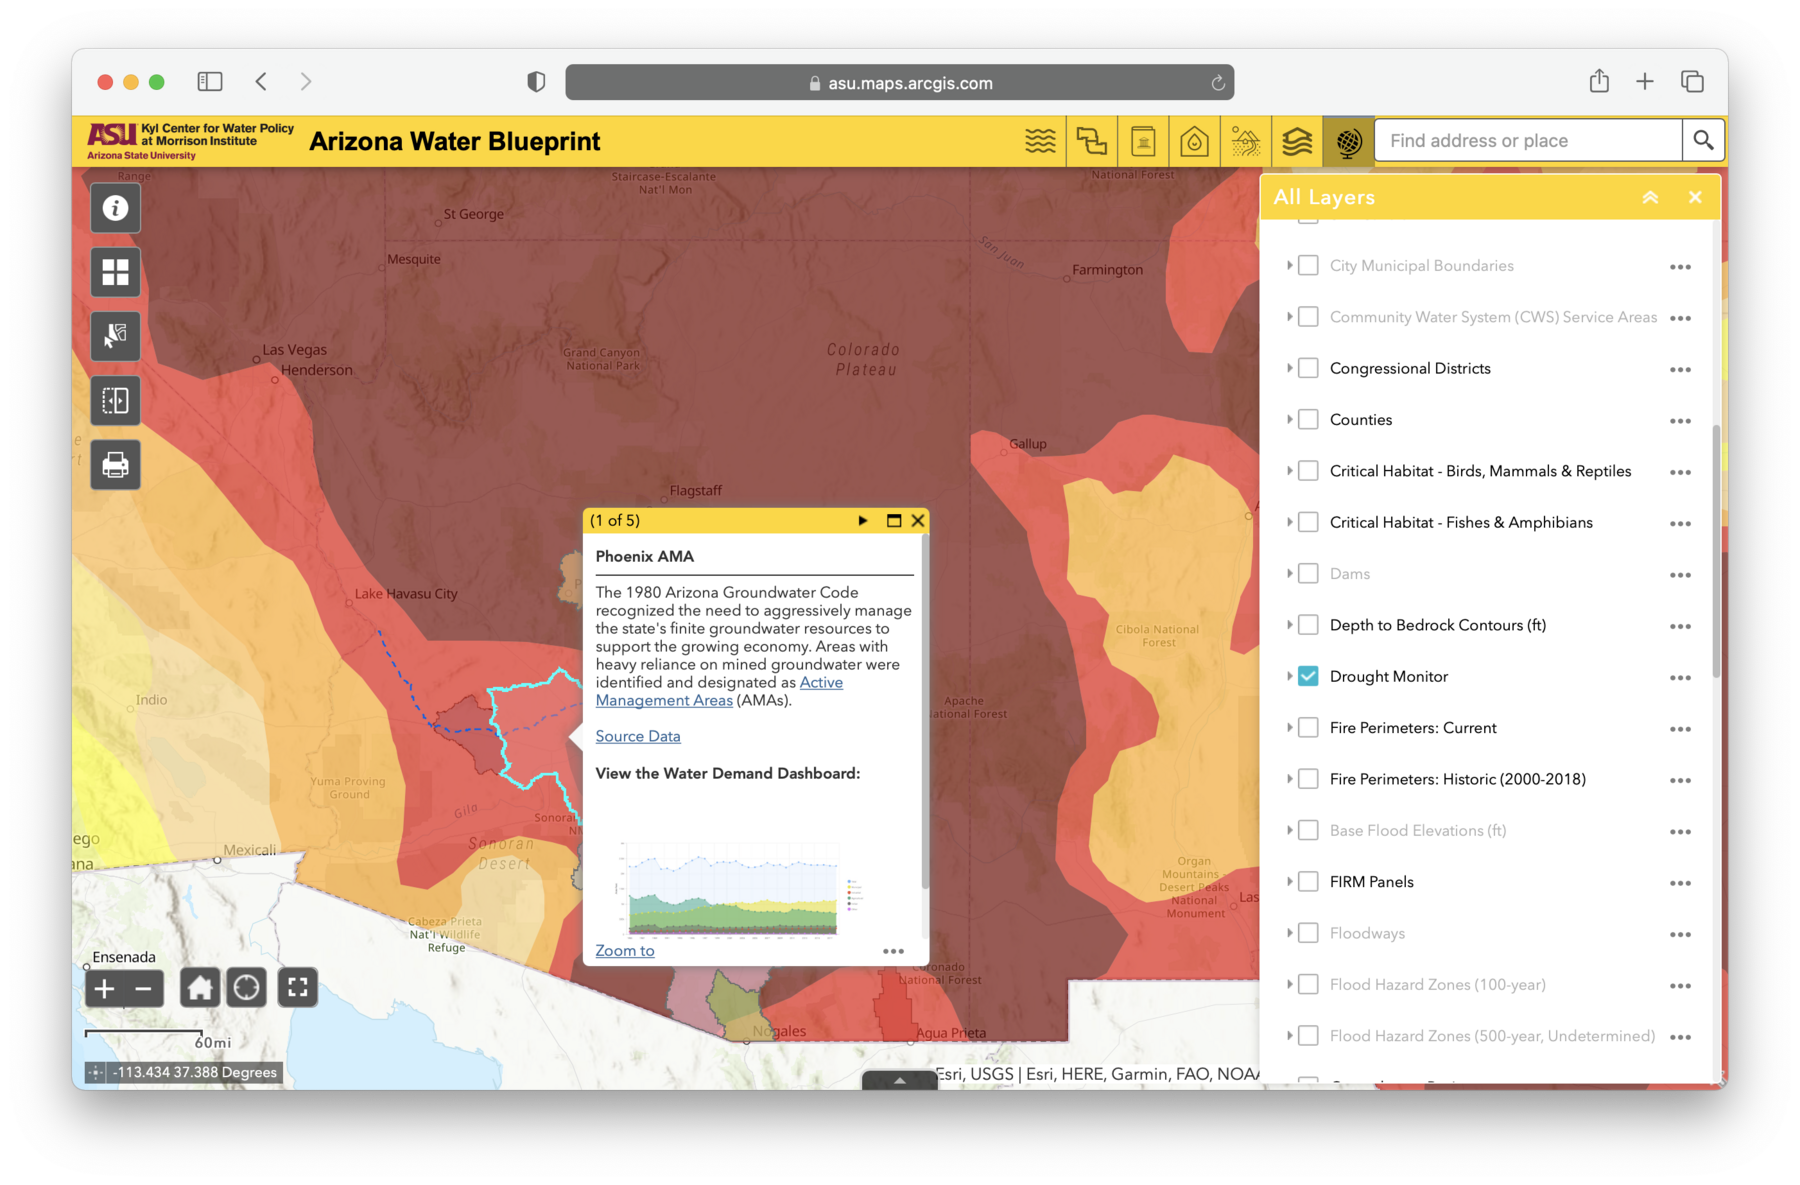
Now, users can connect directly from the Blueprint to data dashboards about water demand by sector in each Active Management Area, groundwater levels in groundwater sub-basins, tribal allocations of Colorado River water, and water withdrawals in Irrigation Non-expansion Areas.
We've uploaded more than a dozen new data layers, bringing the total number of data layers to 55, including flood hazards, precipitation, superfund sites, current and historic fires, irrigation grandfathered rights, and depth to bedrock.
We've also improved the pop-ups on the Blueprint map by including more images and links to data and resources to enhance the user experience.
New to the Arizona Water Blueprint?
If you haven’t used the Arizona Water Blueprint yet, give it a try!
The Blueprint’s easy-to-deploy tools allow data to be layered and explored with just a few clicks. A user can view and download water-related data specific to a particular geography and visualize how different datasets are connected.
Not sure how to get started? Check out the Quick Start Guide and video tutorials to learn how to use some of the most important Blueprint tools.
Learn more about the Arizona Water Blueprint
Read about the Arizona Water Blueprint's features and how it came about in a recent article published by Esri, the company behind the powerful mapping tool ArcGIS. The Arizona Water Blueprint relies on ArcGIS to display its many layers of data and information.