Groundwater Level Change App Launched
Groundwater is a critical resource in Arizona, and changes in demand for groundwater have given rise to growing concern about the long-term resilience of some of the state’s aquifers.
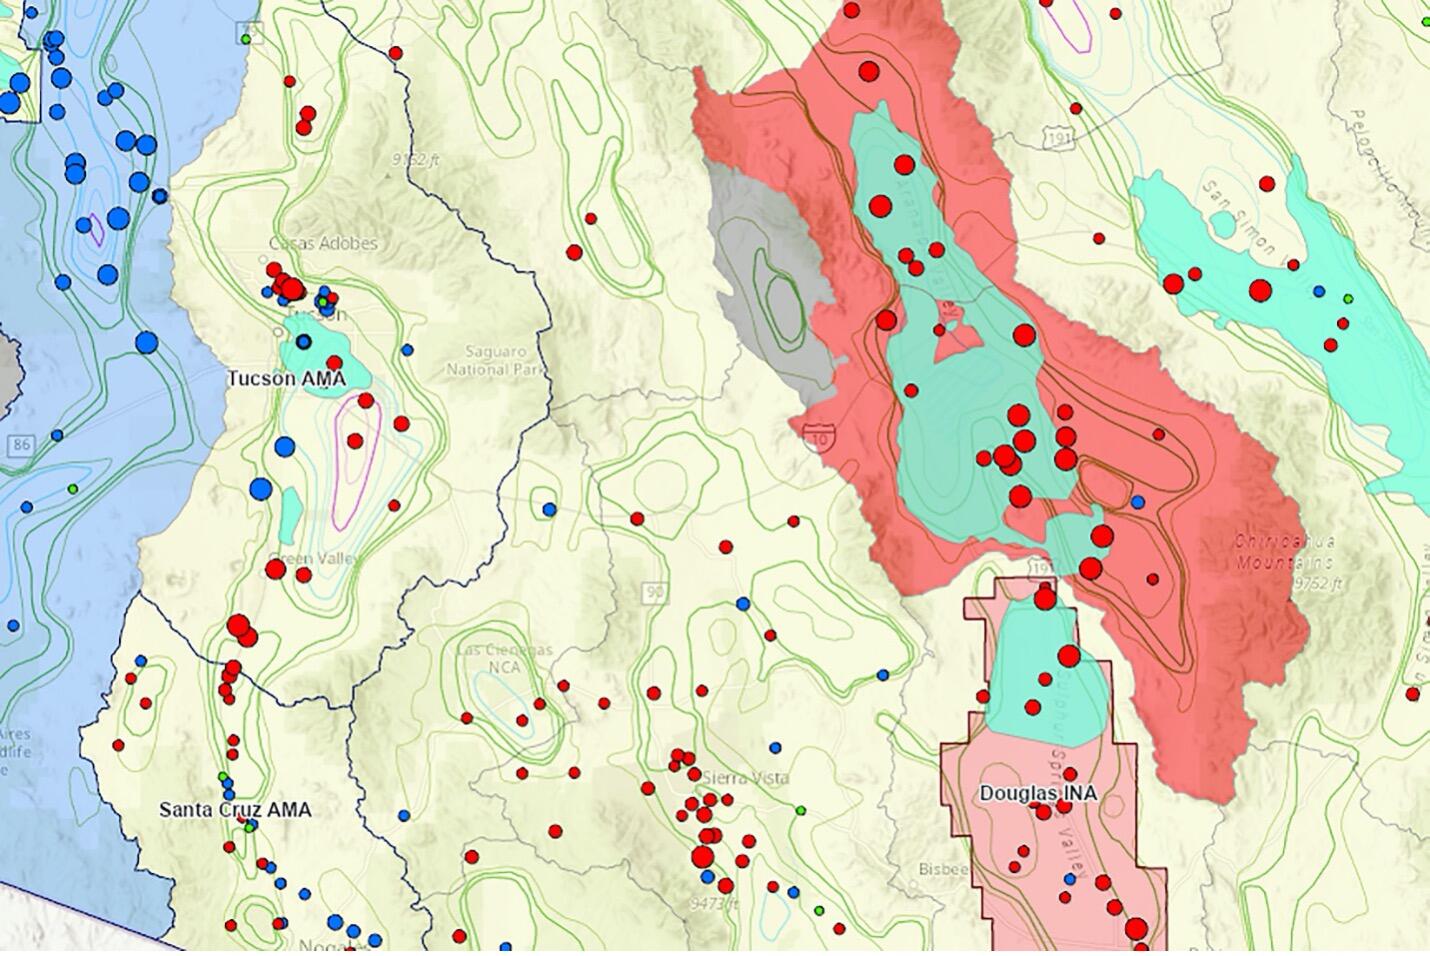
This image above is from the Kyl Center for Water Policy’s new Arizona Groundwater Level Change App, an extension of the Arizona Water Blueprint, which shows what’s happening in sub-basins across the state — where groundwater levels are rising or declining and where more data may be needed. The data for this powerful new tool are derived from the Arizona Department of Water Resources Statewide Groundwater Level Changes report (Open-File Report No.18, December 2020).
New strategies and actions are needed to secure the long-term sustainability of groundwater in the state. The Arizona Groundwater Level Change App can be used by the general public, water managers, and decision-makers to understand groundwater concerns and support decision-making and effective policy.
This captured map image above displays water level change statistics over a 20-year period, between 1998 and 2018. Wells are symbolized by changes in depth to groundwater measurements (feet), and sub-basins are symbolized by the median rate of change (feet/year). Red signifies sub-basins and wells experiencing groundwater declines, while blue signifies rising groundwater levels. Active Management Areas (AMAs), Irrigation Non-Expansion Areas (INAs), depth to bedrock contours, and areas of land subsidence are also depicted.
Wells pull water from underground aquifers, which are pockets within underlying bedrock. Land subsidence occurs when large amounts of groundwater have been withdrawn from certain types of rock, such as fine-grained sediments. The rock compacts because the water is partly responsible for holding the ground up. When the water is withdrawn, the rock falls in on itself.
The Willcox sub-basin, pictured here above the Douglas INA, has the highest land subsidence rate in Arizona. The communities and farms in this 2,000 square mile basin in the southeastern corner of Arizona have seen a significant increase in groundwater-dependent agriculture — a combination of large-scale industrial farms and small-scale vineyards.
With the Groundwater Level Change App, users can learn that the median rate of groundwater level change in the Wilcox sub-basin was -2.2 feet per year between 1998 and 2018. They can view hydrographs and site information for each individual well. Due to groundwater pumping far exceeding the natural rate of recharge, groundwater levels in this area will likely continue to decline, resulting in continued land subsidence. This image is an example of how the Kyl Center for Water Policy is leveraging Geographic Information Systems technology to help users visualize what’s happening with groundwater — and where — so that we can all start talking about solutions.