
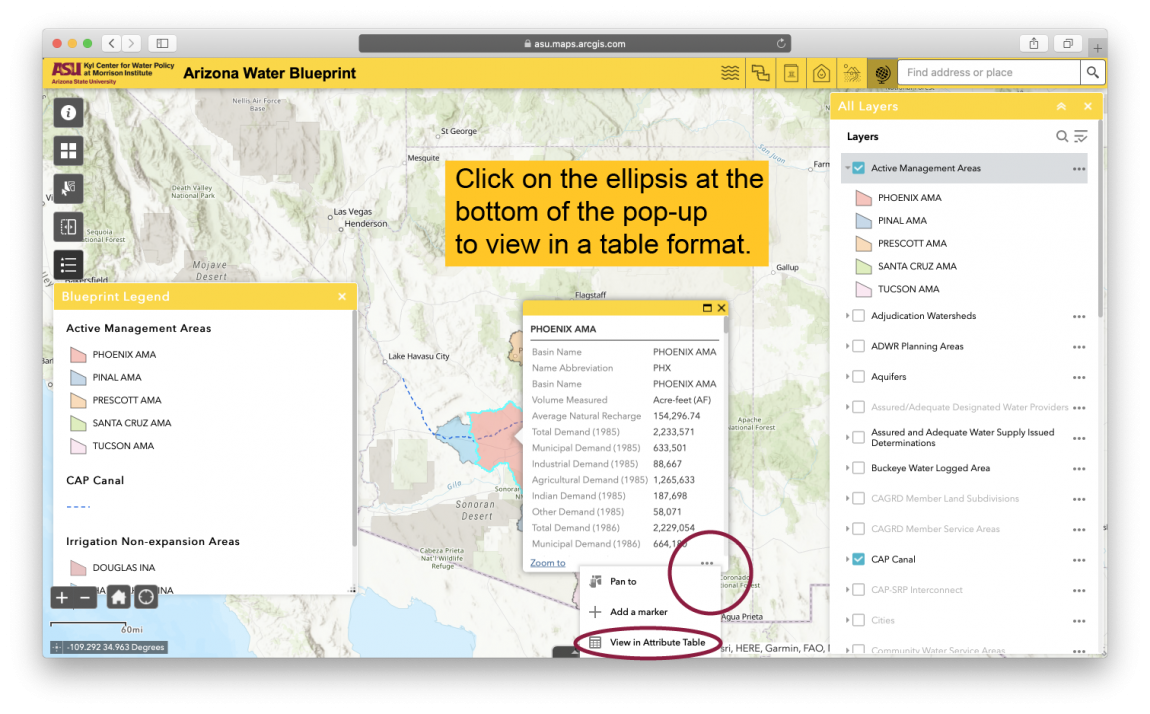
Orientation: Getting Started Using the Water Blueprint

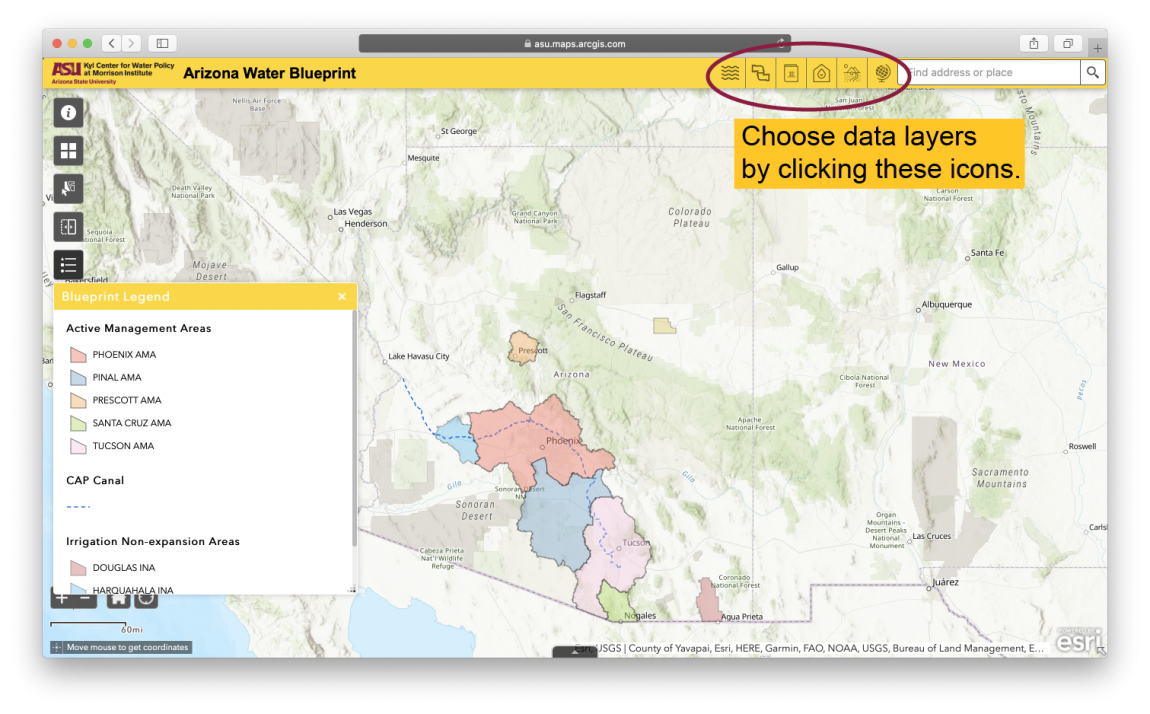
The Arizona Water Blueprint website helps answer questions about water supply and use by creating a holistic view of water in Arizona. With just a few clicks, you can explore Arizona’s water landscape and learn about Arizona’s water resources and infrastructure.

icon showing water drop

Water Glossary

The water glossary provides definitions for map layers and terms used throughout the Blueprint.

Quick Start Guide

Five easy steps to start using the comprehensive map.


Step 1

Choose a data layer by clicking one of the icons in the upper right corner of the viewer.

The map and data layers are divided into categories with similar feature attributes or themes. From left to right: Hydrography, Political & Regulatory, Infrastructure, Habitat, and Augmentation. All layers within each group are listed alphabetically.

Screenshot of blueprint viewer showing data layer icons in in upper region of screen

Step 2

Select specific layers by clicking in the box to the left of the layer name.

Click on the ellipsis (the three dots) to the right of the layer name for viewing and other options.

Screenshot of blueprint viewer showing how to select specific layers.

Step 3

View the legend by clicking the drop-down arrow to the left of the checked box.

The legends for all selected layers will also appear in the Blueprint Legend pop-up box, which can be minimized and restored by clicking the icon at the bottom of the vertical column of icons on the left side of the Blueprint viewer.

Screenshot of blueprint viewer showing how to view the legend by clicking the arrow next to the checked layer box

Step 4

Once you’ve selected the data layers of interest, start exploring.

Click map attributes to open pop-ups with additional details and data.

Use the pop-up scroll bar on the right to view all available information.

Screenshot of blueprint viewer showing how to click on an attribute on the map to open additional information

Step 5

Click on the ellipsis at the bottom of the pop-up to view in a table format.

Like a spreadsheet, an attribute table can help you easily see and compare data. It will appear at the bottom of your browser window.


Screenshot of blueprint viewer showing how to view the attribute table to compare data